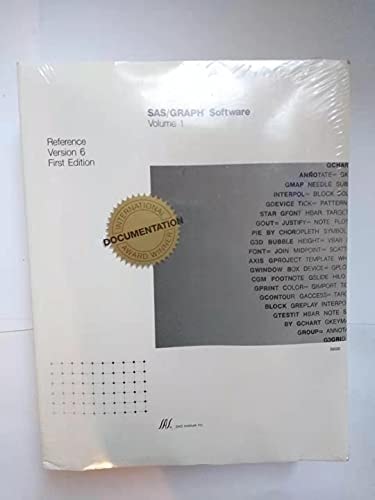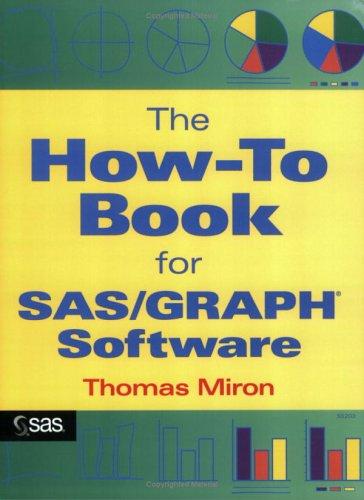
The How-To Book for SAS/GRAPH Software
0
0
As an Amazon Associate and affiliate partner, Menrva Books earns from qualifying purchases. Learn more
Author Description
Author description coming soon. We're reaching out to them in the ether...
Menrva's Summary
THE THESIS
This book serves as a comprehensive guide to utilizing the SAS/GRAPH software for data visualization and reporting. Authored by Thomas Miron, a presumed expert in SAS programming, the text aims to demystify the complexities of SAS/GRAPH, providing users with the practical knowledge needed to create effective graphical representations of their data. It focuses on the application of the software's features to generate a wide array of charts, plots, and other visual outputs essential for data analysis and presentation.
THE SCOPE MAP
- Detailed explanations of SAS/GRAPH procedures and syntax.
- Examples for creating various types of graphs, including bar charts, pie charts, scatter plots, and more.
- Guidance on customizing graph appearance, such as colors, fonts, and labels.
- Techniques for integrating SAS/GRAPH output into reports and other documents.
- Practical advice for troubleshooting common issues encountered when using the software.
THE AUTHORITY PERSPECTIVE
This book is likely regarded as a practical, hands-on manual for users of SAS/GRAPH software. Its focus on 'how-to' suggests it is intended for individuals seeking to learn or improve their skills in data visualization using SAS. The technical nature of the subject matter implies a readership of data analysts, statisticians, and programmers who work with SAS.
Page Count:
336
Publication Date:
1995-01-01
ISBN-10:
1555442331
ISBN-13:
9781555442330
Business
Non-Fiction
Science & Technology
Computer graphics
Software Documentation
Community Tags
Similar Books