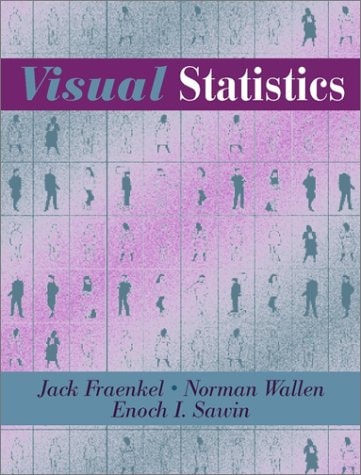
Visual Statistics
0
0
As an Amazon Associate and affiliate partner, Menrva Books earns from qualifying purchases. Learn more
Author Description
Statistics can be seen by many as a difficult or intimidating subject. Yet, those same individuals that are intimidated by the subject often need to use statistics. This book serves to make sense out of seemingly complex concepts and to offer an easy, visual way to understanding and using statistics. This book is written in a clear, easy-to-read manner with the intention of making statistics simple. Through visual diagrams of the essential concepts used in statistical research, the book provides concise, short explanations designed to retain the readers' interest. The intelligent use of cartoons, figures, graphs, and charts make otherwise foreboding concepts easily understandable. Topics include correlation, regression, probability and measurements, amongst others. Statistics teachers, and anyone needing to use statistics in their work.
Menrva's Summary
THE THESIS
This book investigates how visual representation can demystify complex statistical concepts for individuals who find traditional mathematical instruction intimidating. The authors, Enoch I. Sawin, Jack R. Fraenkel, and Norman E. Wallen, utilize their expertise in educational research to strip away the abstraction typically associated with quantitative analysis. By replacing dense text with a framework of diagrams, cartoons, and charts, they provide a bridge for students and professionals to grasp essential statistical methodologies without the barrier of high-level mathematical jargon.
THE SCOPE MAP
What You Will Find
- Visual diagrams and cartoons illustrating core statistical concepts
- Explanations of correlation, regression, and probability
- Practical guidance on measurement techniques
- Concise summaries designed for quick comprehension and retention
THE AUTHORITY PERSPECTIVE
The framing suggests an accessible, introductory-level resource designed to lower the barrier to entry for students and practitioners who struggle with traditional statistical textbooks. Its reliance on visual aids and simplified explanations indicates a focus on pedagogical utility rather than theoretical depth.
Page Count:
368
Publication Date:
1999-01-15
Publisher:
Allyn & Bacon
ISBN-10:
0205283179
ISBN-13:
9780205283170
Statistics
Mathematics
Reference
Data Analysis
Education
Community Tags
Similar Books