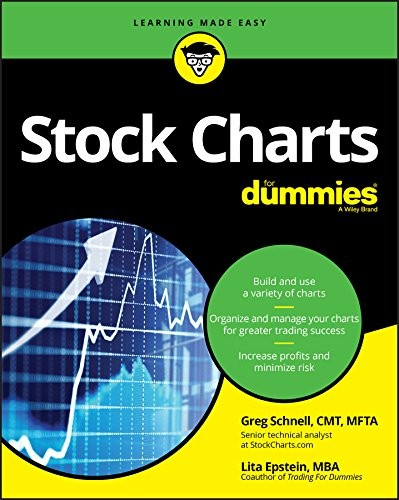
Stock Charts For Dummies
0
0
As an Amazon Associate and affiliate partner, Menrva Books earns from qualifying purchases. Learn more
Author Description
Many trading and technical analysis books focus on how to use charts to make stock trading decisions, but what about how to actually build a chart? Stock Charts For Dummies reveals the important stories charts tell, and how different parameters can impact what you see on the screen. This book will explain some of the most powerful display settings that help traders understand the information in a chart to find outperformance as its beginning. Stock Charts for Dummies will teach you how to build a visually appealing chart and add tools based on the type of trading or investing decision you're trying to make. It will also introduce you to the pros, cons, and best practices of using three key types of charts: Candlesticks, Bar Charts, and Line Charts. --
Menrva's Summary
THE THESIS
This book demystifies the construction and interpretation of stock charts, revealing the narratives embedded within visual trading data. It aims to equip traders and investors with the knowledge to build effective charts, understand how various parameters influence visual information, and select appropriate chart types and tools for their specific decision-making needs.
THE SCOPE MAP
- Explanation of how to build stock charts from raw data.
- Guidance on understanding the stories charts tell and the impact of different parameters.
- Introduction to powerful display settings for identifying outperformance.
- Instructions on creating visually appealing charts and adding relevant tools.
- Detailed examination of the pros, cons, and best practices for Candlestick, Bar, and Line charts.
THE AUTHORITY PERSPECTIVE
This book is designed as an accessible guide for individuals new to technical analysis, focusing on the practical aspects of chart creation and interpretation. The 'For Dummies' series typically aims for clarity and ease of understanding, suggesting this book would be suitable for beginners seeking to grasp fundamental charting techniques. It likely provides a foundational understanding of how to use visual data to inform trading and investment decisions.
Page Count:
342
Publication Date:
2018-01-01
ISBN-10:
1119434394
ISBN-13:
9781119434399
Non-Fiction
Business
Art
Trading
Technical Analysis
Stock Market
Investing
Community Tags
Similar Books