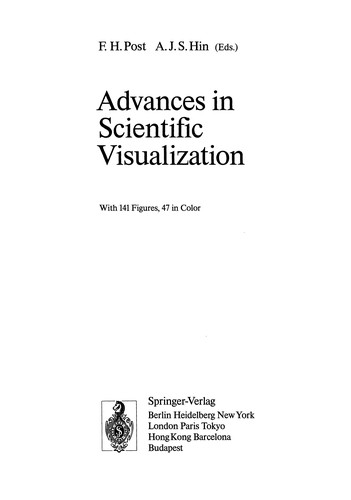
Advances in Scientific Visualization
0
0
As an Amazon Associate and affiliate partner, Menrva Books earns from qualifying purchases. Learn more
Author Description
Scientific visualization is a new and rapidly growing area in which efforts from computer graphics research and many scientific and engineering disciplines are integrated. Its aim is to enhance interpretation and understanding by scientists of large amounts of data from measurements or complex computer simulations, using computer generated images and animation sequences. It exploits the power of human visual perception to identify trends and structures, and recognize shapes and patterns. Development of new numerical simulation methods in many areas increasingly depends on visualization as an effective way to obtain an intuitive understanding of a problem. This book contains a selection of papers presented at the second Eurographics workshop on Visualization in Scientific Computing, held in Delft, the Netherlands, in April 1991. The issues addressed are visualization tool and system design, new presentation techniques for volume data and vector fields, and numerous case studies in scientific visualization. Application areas include geology, medicine, fluid dynamics, molecular science, and environmental protection. The book will interest researchers and students in computer graphics and scientists from many disciplines interested in recent results in visual data analysis and presentation. It reflects the state of the art in visualization research and shows a wide variety of experimental systems and imaginative applications.
Menrva's Summary
THE THESIS
Scientific visualization aims to enhance scientific interpretation and understanding of large datasets through computer-generated imagery. This field integrates computer graphics research with various scientific and engineering disciplines, leveraging human visual perception to identify trends, structures, shapes, and patterns. The book presents papers from the second Eurographics workshop on Visualization in Scientific Computing, focusing on visualization tool and system design, new techniques for volume and vector field data, and case studies across diverse application areas. It reflects the state of the art in visualization research, showcasing experimental systems and imaginative applications.
THE SCOPE MAP
- Visualization tool and system design
- New presentation techniques for volume data
- New presentation techniques for vector fields
- Case studies in scientific visualization
- Applications in geology
- Applications in medicine
- Applications in fluid dynamics
- Applications in molecular science
- Applications in environmental protection
THE AUTHORITY PERSPECTIVE
This book compiles papers from a 1991 workshop, reflecting the state of the art in scientific visualization at that time. The collection addresses key issues in visualization system design and data presentation techniques, supported by numerous case studies across various scientific fields. It offers insights into the integration of computer graphics with scientific disciplines for enhanced data interpretation. The content is likely to be of interest to researchers and students in computer graphics and scientists utilizing visual data analysis.
Page Count:
209
Publication Date:
1992-01-01
ISBN-10:
3642773362
ISBN-13:
9783642773365
Science
Non-Fiction
Engineering
Scientific Computing
Simulation
Computer graphics
Community Tags
Similar Books