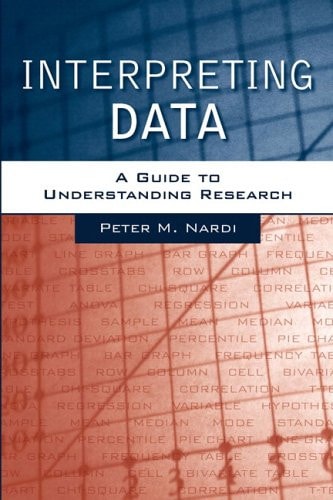
Interpreting Data (with Research Navigator)
0
0
As an Amazon Associate and affiliate partner, Menrva Books earns from qualifying purchases. Learn more
Author Description
With Research Navigator.Written in non-technical, everyday language, this supplementary text is a quick guide to understanding data. Readers will learn about and practice working with graphs and tables found in popular and scholarly publications, and understand the output from statistical software.Statistics, tables, graphs, and figures discussed are presented in four steps:Defining itDescribing where it should or should not be used.Showing how it is used in a popular magazine or newspaper, academic journal, or in output from SPSS software.Discussing how to interpret its meaning.
Menrva's Summary
THE THESIS
This text investigates the core question of how students and researchers can effectively interpret statistical data presented in various media and academic formats. Peter M. Nardi, a professor of sociology, leverages his expertise in quantitative research methods to provide a bridge between raw statistical output and meaningful analysis. The book utilizes a structured four-step pedagogical framework to demystify complex figures, tables, and software outputs for the non-specialist reader.
THE SCOPE MAP
What You Will Find
- A four-step methodology for analyzing graphs, tables, and figures.
- Practical guidance on interpreting statistical output from SPSS software.
- Comparative analysis of data presentation in popular media versus academic journals.
- Foundational techniques for identifying appropriate and inappropriate data usage.
THE AUTHORITY PERSPECTIVE
The text is regarded as a highly accessible, entry-level resource for students navigating the complexities of quantitative data interpretation. Its straightforward, non-technical approach makes it a standard supplementary tool for undergraduate courses in sociology and research methods.
Page Count:
0
Publication Date:
2005-05-23
Publisher:
Allyn & Bacon
ISBN-10:
0205482074
ISBN-13:
9780205482078
Statistics
Education
Statistical methods
Research Methods
Social Surveys
Reference
Data Analysis
Social Research
Community Tags
Similar Books