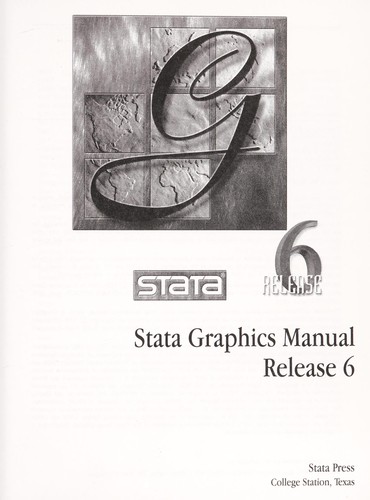
Stata Graphics Manual
0
0
As an Amazon Associate and affiliate partner, Menrva Books earns from qualifying purchases. Learn more
Author Description
Author description coming soon. We're reaching out to them in the ether...
Menrva's Summary
THE THESIS
This manual serves as a comprehensive guide to creating effective data visualizations using Stata software. It details the principles of good graphical design and provides practical instructions for implementing various chart types within the Stata environment. The book aims to equip users with the knowledge to produce clear, informative, and publication-quality graphics for statistical analysis and reporting.
THE SCOPE MAP
- Detailed explanations of Stata's graphing commands and options.
- Guidance on choosing appropriate graph types for different data structures and analytical goals.
- Examples of creating common statistical plots such as scatterplots, bar charts, histograms, and box plots.
- Techniques for customizing graph aesthetics, including colors, labels, titles, and legends.
- Strategies for combining multiple graphs and creating complex visualizations.
- Best practices for producing publication-ready graphics.
THE AUTHORITY PERSPECTIVE
This manual is recognized as an authoritative resource for Stata users seeking to master data visualization. Its detailed approach and practical examples make it an indispensable tool for anyone needing to present statistical data effectively. The content is structured to guide users from basic plotting to advanced customization, ensuring a thorough understanding of Stata's graphing capabilities.
Page Count:
159
Publication Date:
1999-01-01
ISBN-10:
1881228428
Science
Non-Fiction
Statistics
Reference
Software Documentation
Community Tags
Similar Books